
Scan faster
Use high-level market dashboards and visual maps to identify where activity is concentrated before opening individual assets.
Command the wealth
Sepertino brings Iran market intelligence, crypto discovery, smart filters, scanners, heatmaps, and event monitoring into a focused professional workspace.
Product tour
Each workspace is built for a specific decision: monitor exchange events, compare symbols, scan market behavior, map sectors, and surface higher-conviction opportunities.
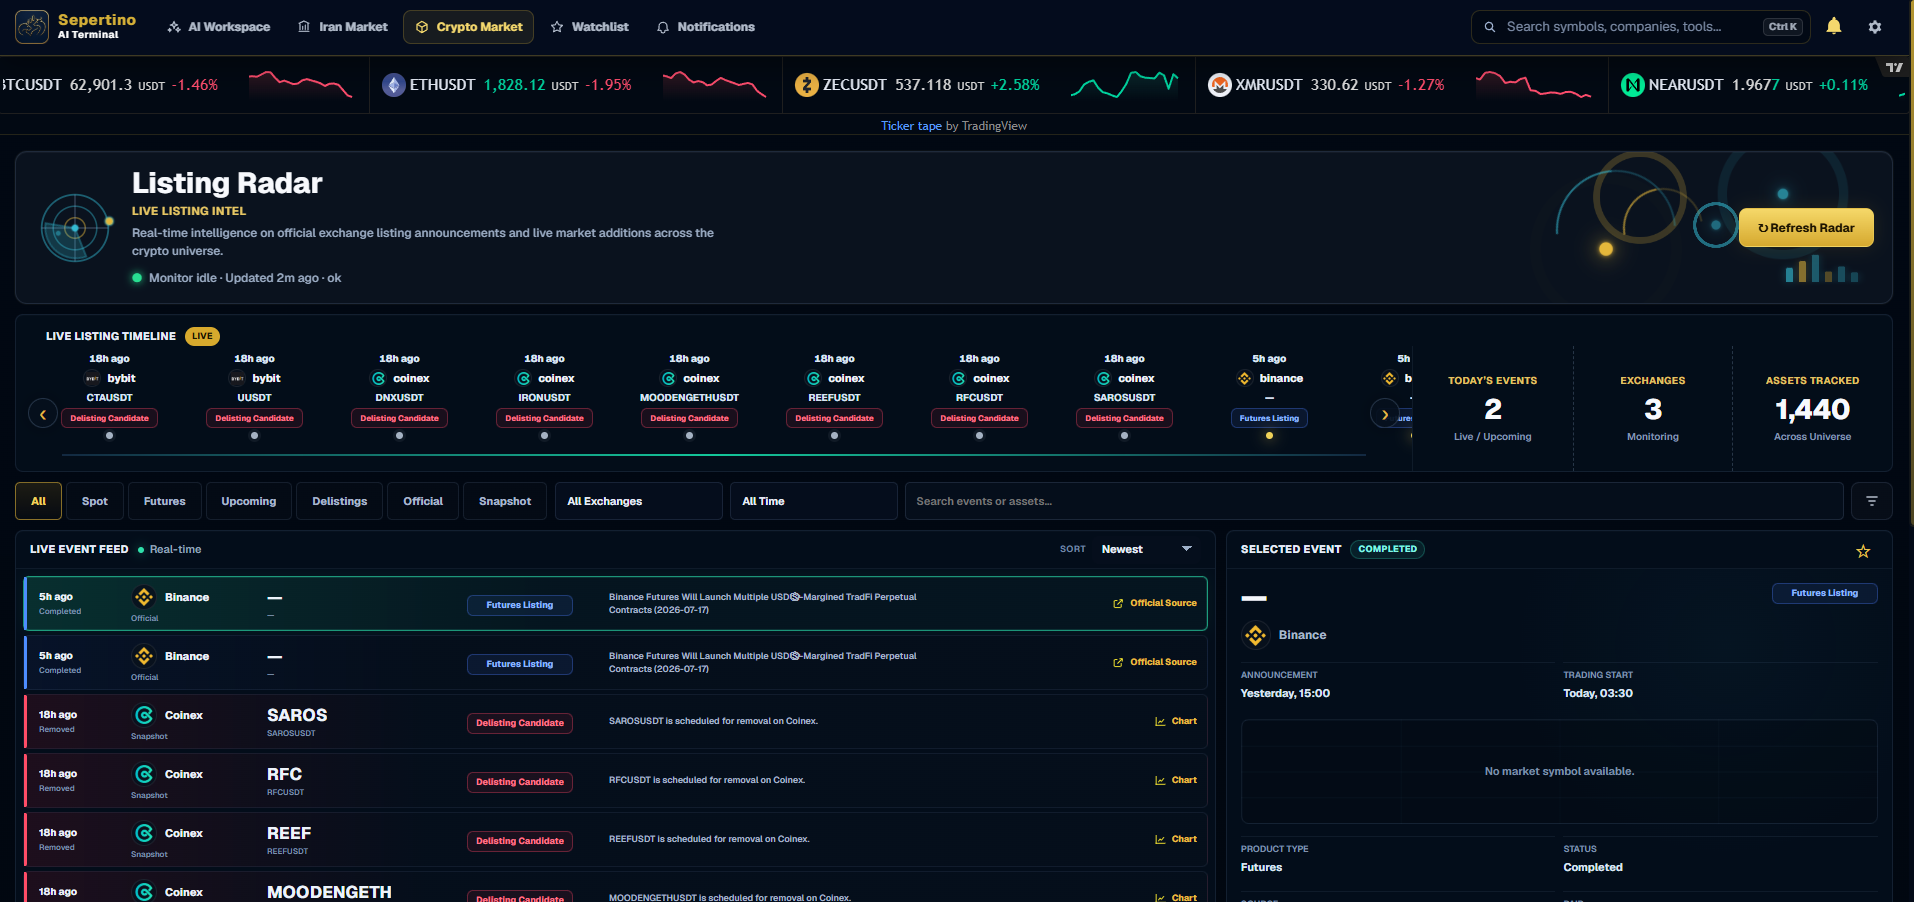
Track listings, futures launches, upcoming trading starts, and delisting candidates across supported exchanges. The event feed combines timing, status, exchange source, and asset context so new market events are immediately understandable.
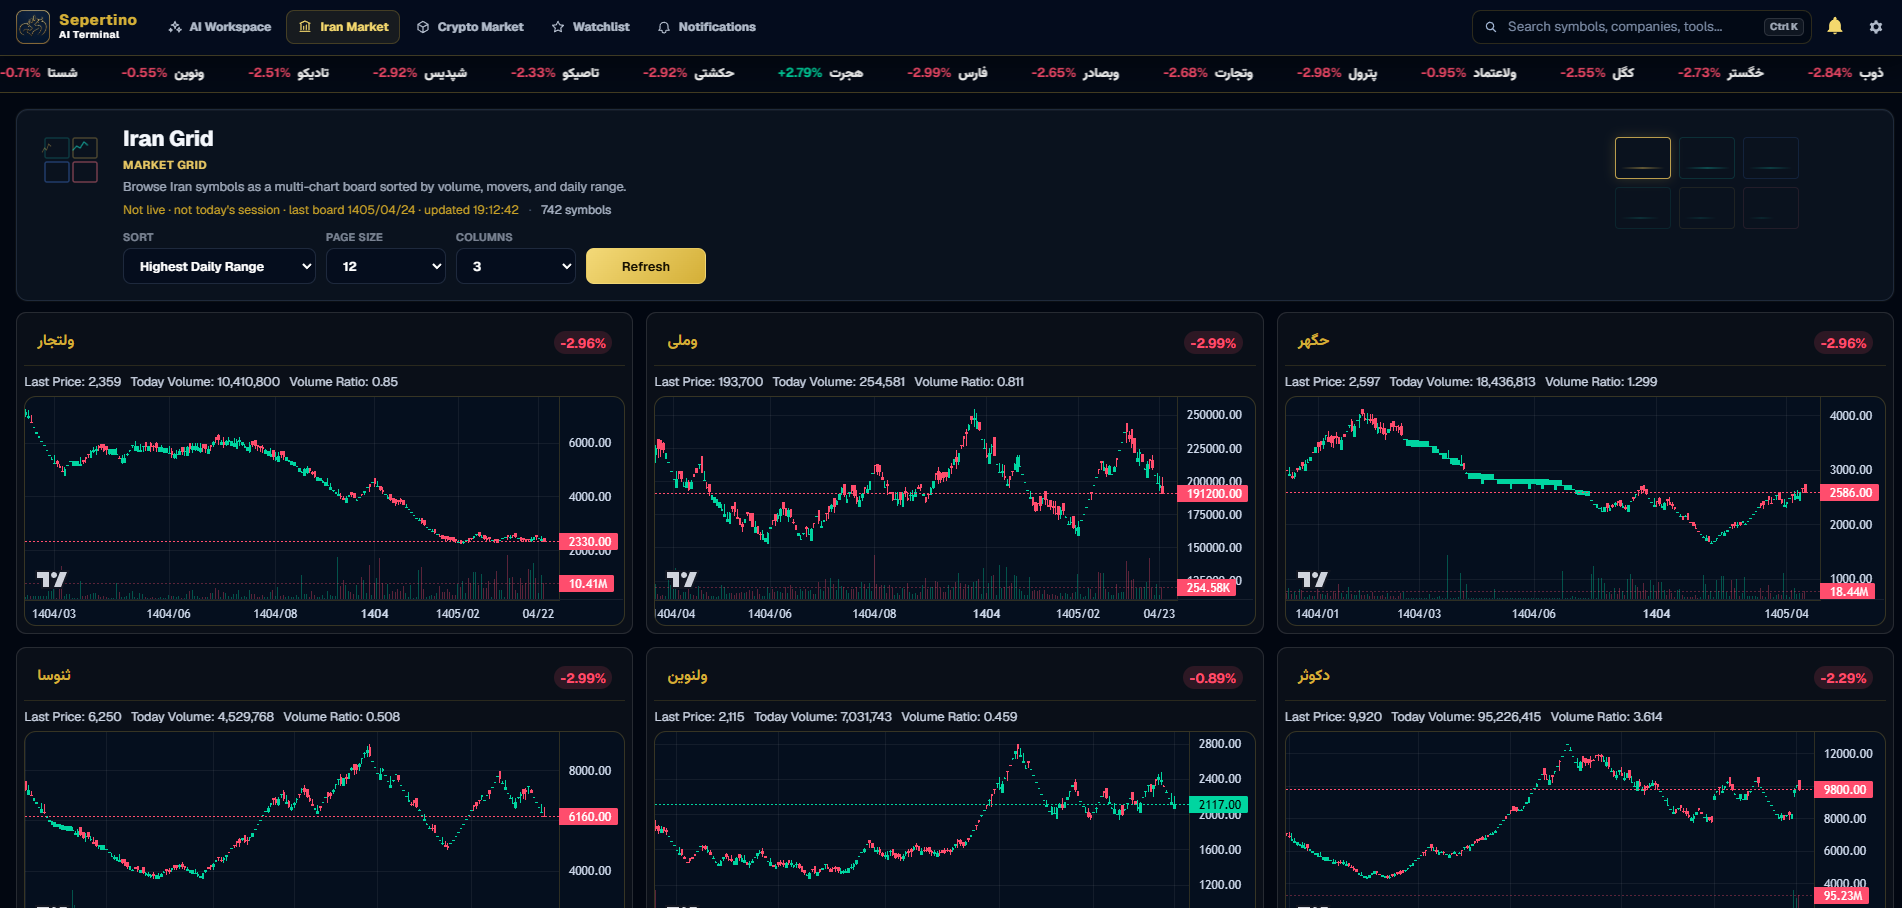
A high-density multi-chart board designed for rapid visual comparison across the Iran market. Sort symbols by activity, range, or other market measures and review price action, volume, and relative movement in a single screen.
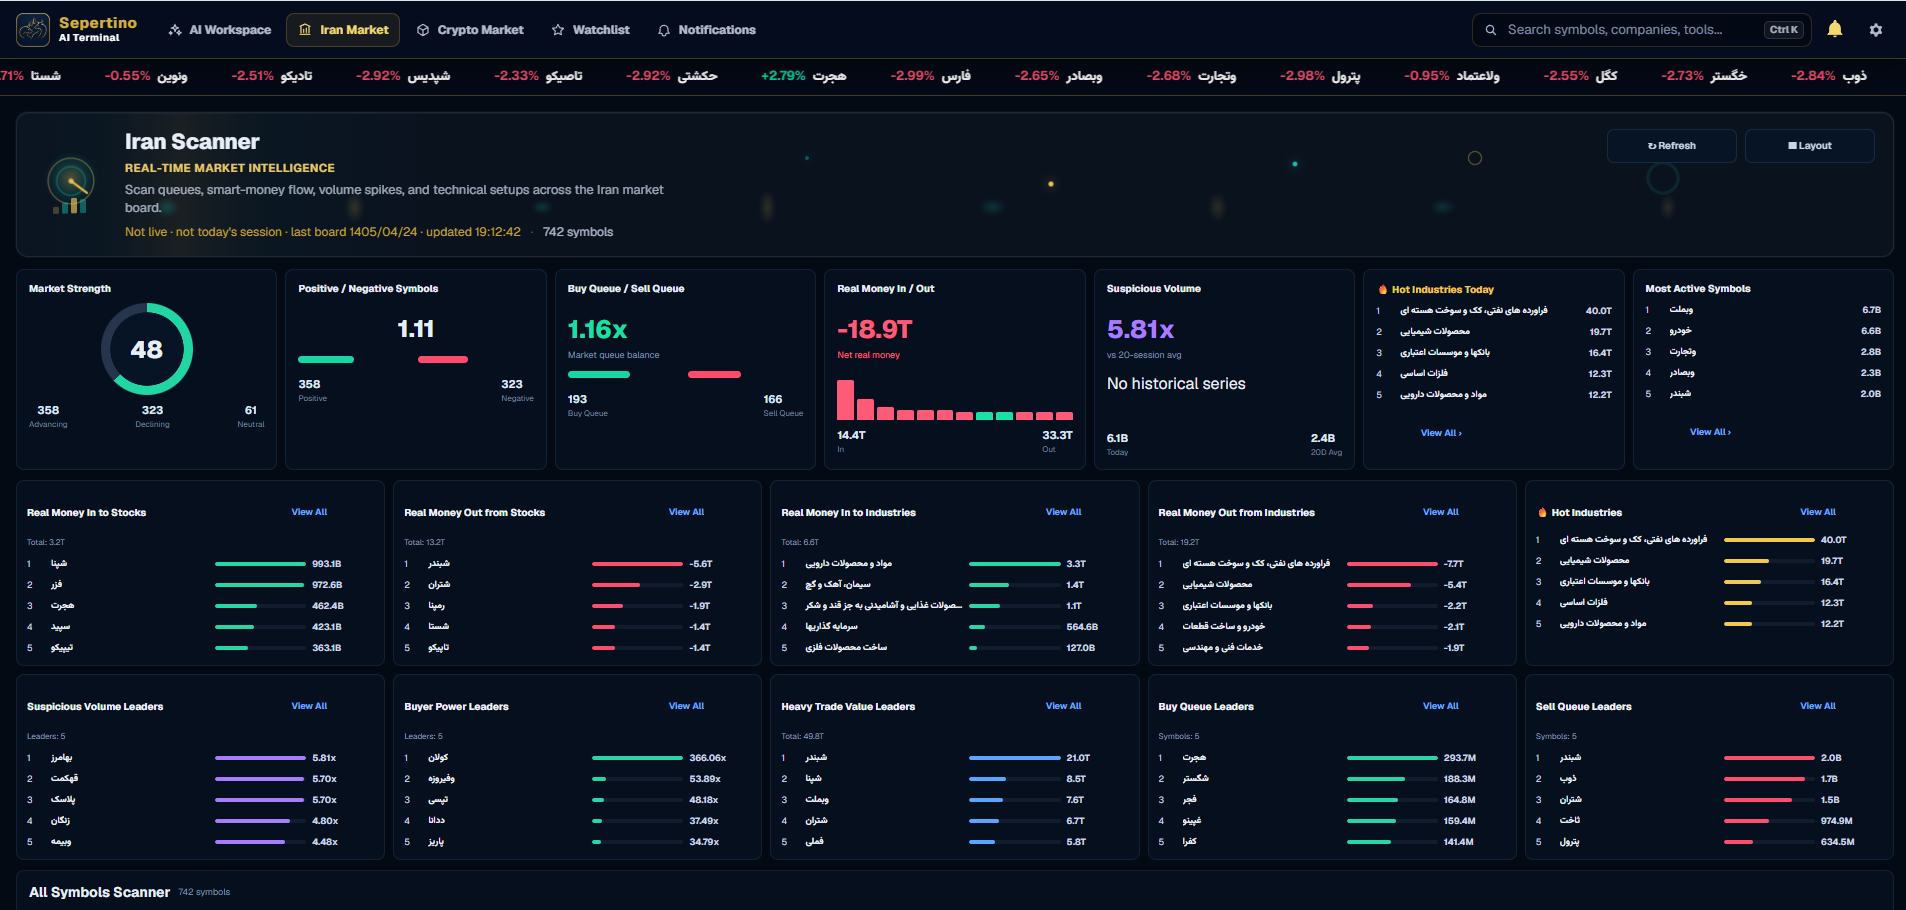
Understand the broad market before opening individual symbols. The scanner summarizes advancing and declining shares, queue balance, real-money flow, suspicious volume, active industries, and the strongest leaders across several behavioral categories.
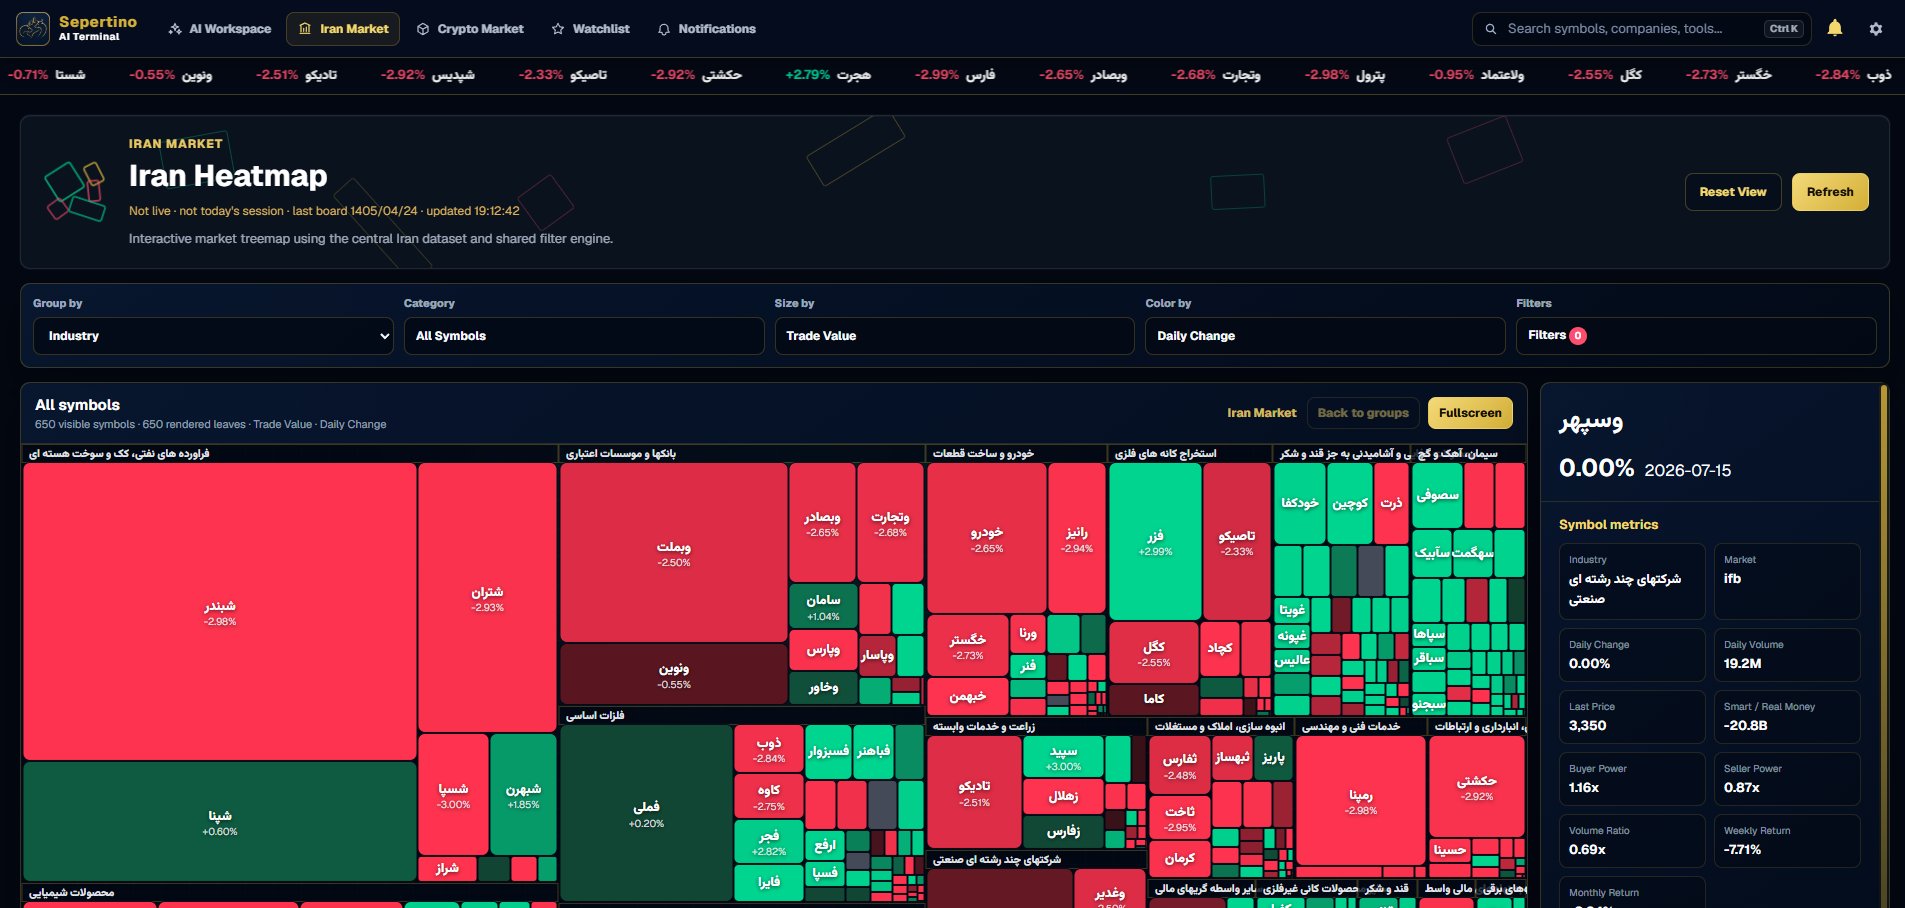
Explore the Iran market through an interactive treemap. Group symbols by industry, size them by trade value or another selected metric, color them by performance, and drill into symbol-level details without leaving the map.
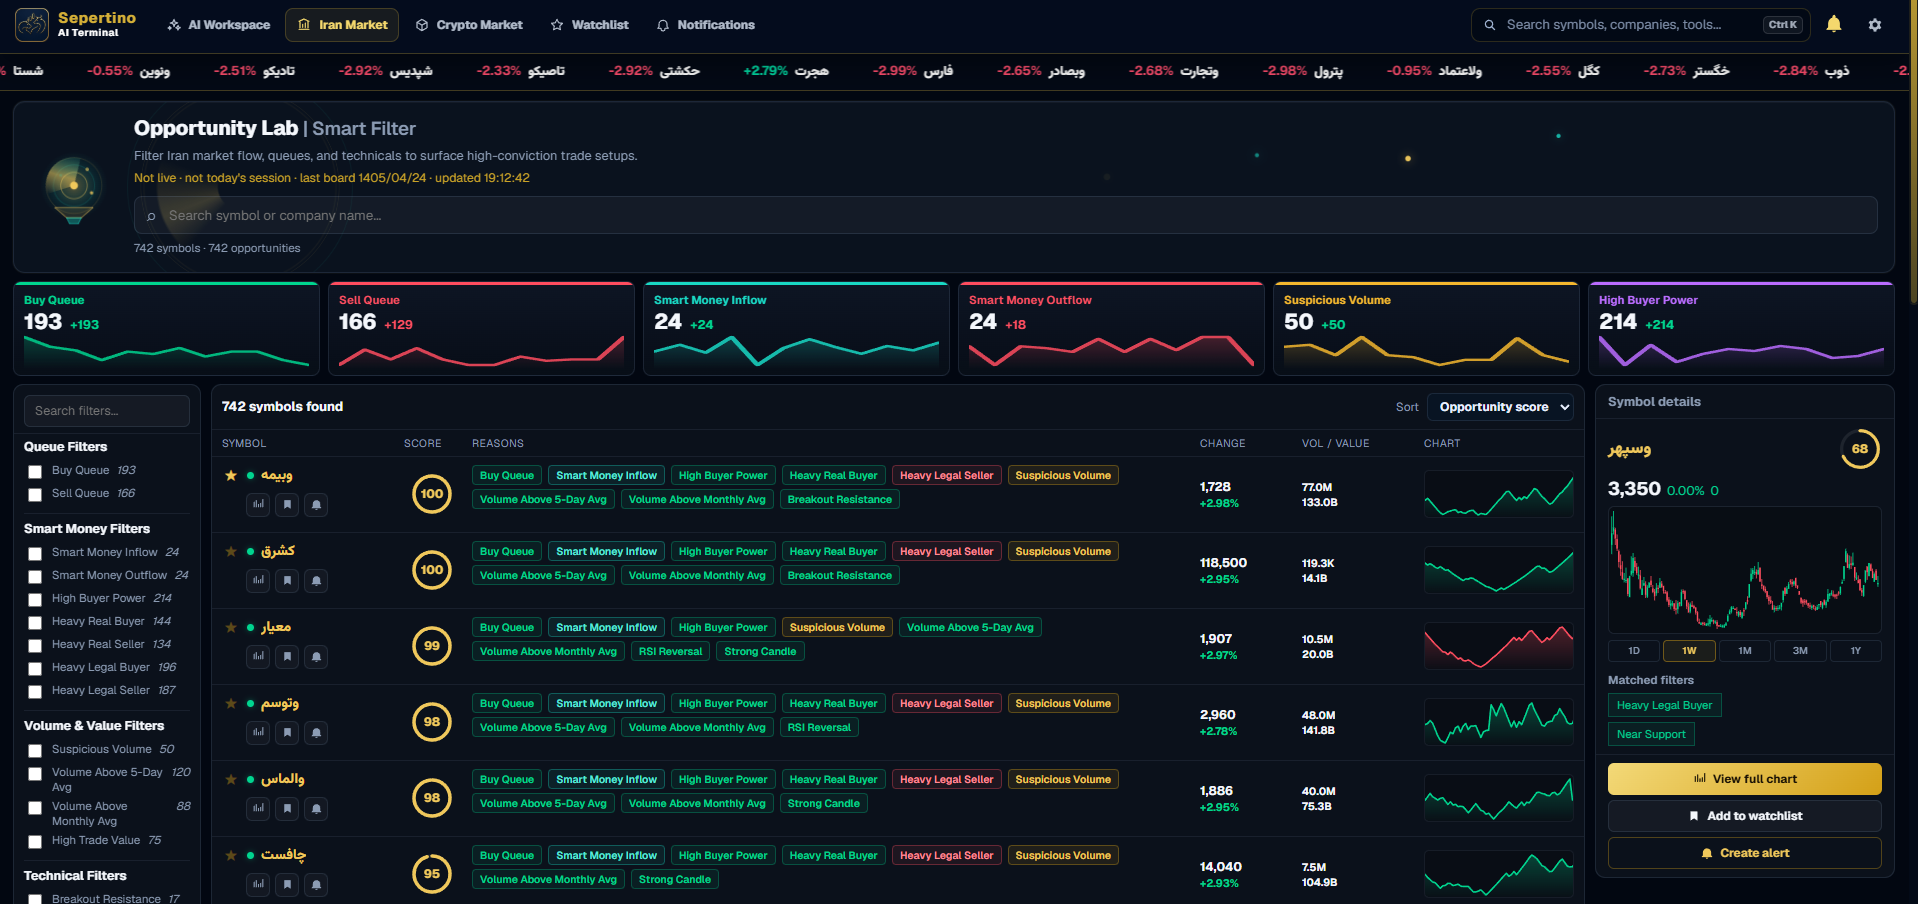
Convert a large market universe into a ranked, explainable shortlist. Opportunity Lab combines queues, smart-money flow, buyer power, volume behavior, technical conditions, and market context while showing exactly why each symbol matched.
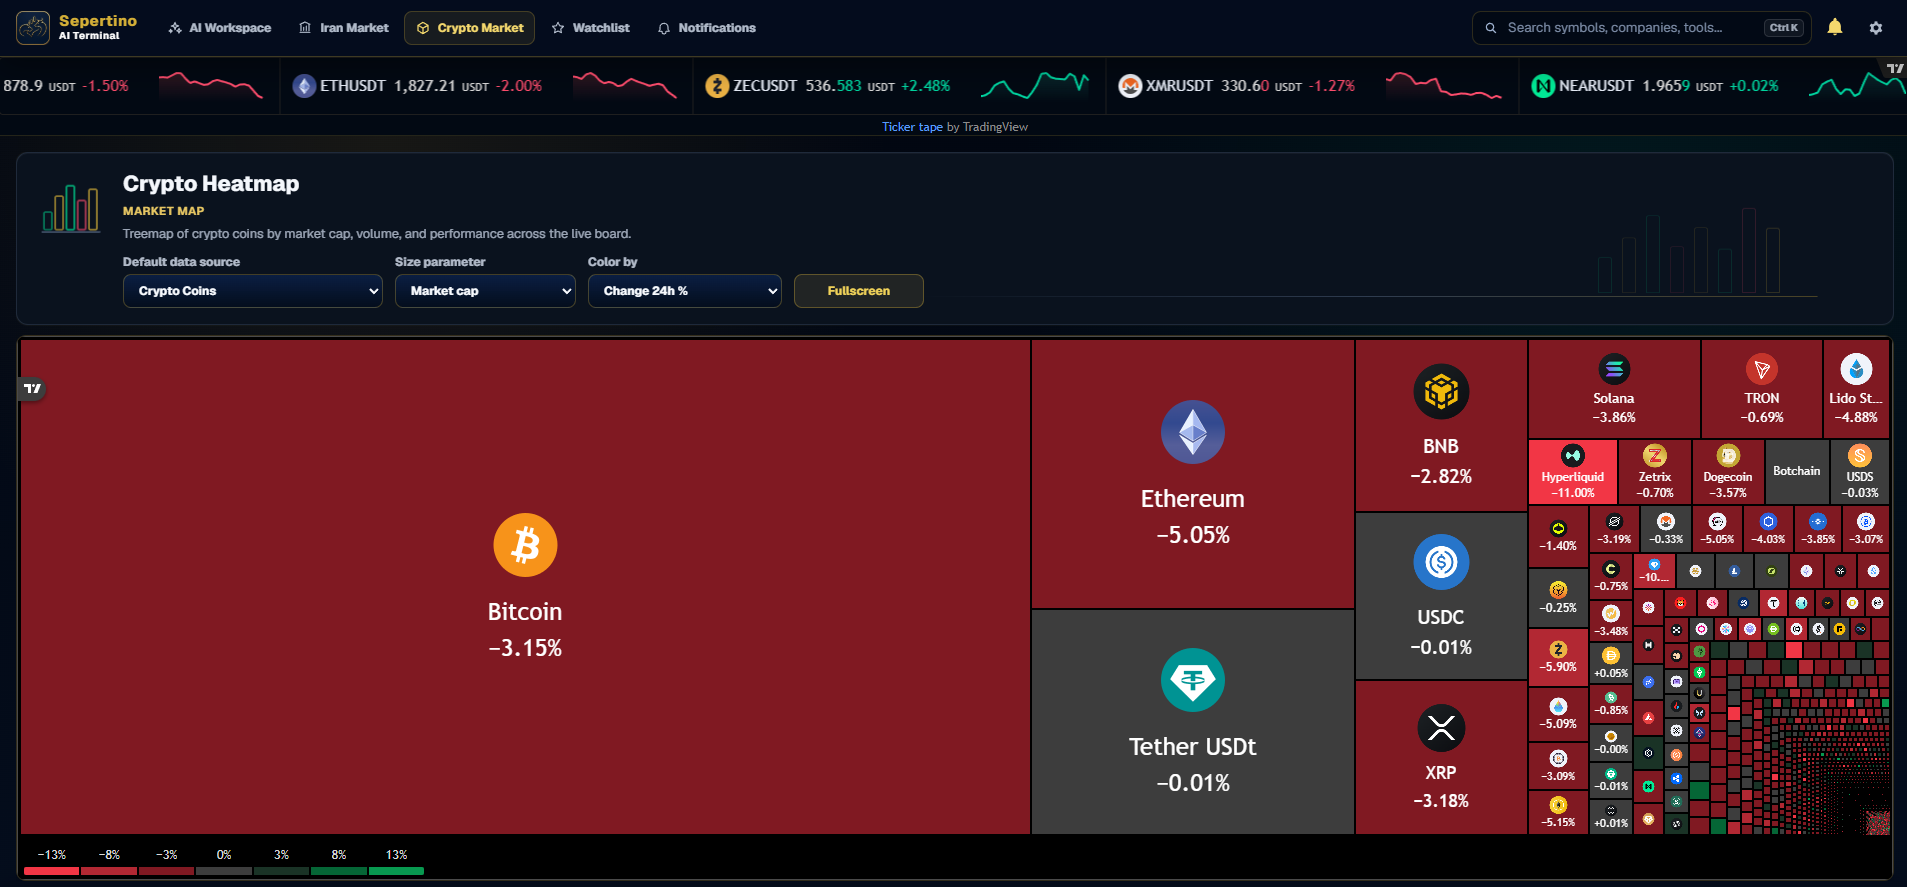
Read broad crypto market performance through a visual map sized by market capitalization and colored by price change. Large assets remain prominent while smaller coins stay visible for quick breadth and concentration checks.
A connected workflow
Move from broad-market context to a ranked shortlist and then into detailed charts without losing the reason a symbol caught your attention.
Use high-level market dashboards and visual maps to identify where activity is concentrated before opening individual assets.
Matched filters and supporting metrics explain why a symbol appears, making the shortlist easier to audit and compare.
Open charts, save to watchlists, and create alerts directly from the same result that surfaced the opportunity.
Sepertino AI Terminal
This demo page presents the core product experience. Continue to Sepertino for account access and the live application.